
The Health Engagement Gradient: Mapping America's Largest Underserved Population
A Framework for Consumer and Behavioral Health Investment

Pre-Clinical Drift: America’s Largest Underserved Population
Working research paper — April 2026
Executive Summary
The U.S. health and wellness industry is functionally built around a binary: clinical (diagnosed, in treatment) and healthy (everyone else). The system recognizes intermediate risk states — prediabetes, prehypertension, “at-risk” classifications — but that stratification runs on claims data, which means it only sees people already in the system, and provider guidelines assume a provider relationship that tens of millions of working adults don’t maintain. The result is a functional binary: if you have a diagnosis and a provider, the system can (imperfectly) serve you.
Consumer wellness products, on the other hand, require self-directed and resourced consumers who already want to improve — a small fraction of the population.
These two approaches miss the largest population in the country — an estimated 80–100 million adults in measurable pre-clinical decline across multiple health domains who have no diagnosis, no consistent provider relationship, no or infrequent intent to seek care, and no product designed to reach them.
This population is in “pre-clinical drift.”
The most serious attempt to address upstream prevention — Medicine 3.0, exemplified by Peter Attia and concierge longevity practices — is proving out the thesis that intervening on trajectory before diagnosis can be much more impactful and cost-effective than treating disease after it arrives. But that model is structurally locked behind high price points, scarce clinicians, and a cultural register that reaches affluent optimizers, not working populations. It’s the correct diagnosis without the reimbursement and structural supports to scale.
This paper proposes a five-tier Health Engagement Gradient that replaces the clinical/healthy binary with a continuous model defined by two axes: health trajectory (improving, stable, declining) and system engagement (active, passive, none).
It quantifies each tier using CDC, NHANES, SAMHSA, and BLS data, identifies the structural reasons the drift population is invisible to existing products and institutions, and maps the non-knowledge-work U.S. workforce to show where the drift is most concentrated and most consequential for employers.
The core claim: under reasonable assumptions about overlap, a plurality of American adults are in pre-clinical drift. It’s very likely the largest or co-largest tier in the framework, larger than the optimizer market by an order of magnitude, and the primary feeder of future chronic disease, disability claims, and workforce productivity loss. No product category currently addresses it.
But pre-clinical drift does not stop at the border of clinical diagnosis. CDC data show that 76% of U.S. adults carry at least one diagnosed chronic condition and 51% have multiple. Many of these individuals are “in the system” on one domain — they take their medication, they see a provider annually — while actively drifting on sleep, substance use, musculoskeletal deterioration, and financial stress.
When pure drift and drift-plus-diagnosis are considered together, the behaviorally drifting population likely exceeds half of U.S. adults — making drift not a niche market segment but the default trajectory for most Americans.
Part I: Why the Existing Taxonomy Fails
The Health System View
Clinical medicine segments populations by diagnosis: you have hypertension or you don’t, you have diabetes or you don’t, you meet criteria for major depressive disorder or you don’t. This produces a clean binary — clinical and non-clinical — that determines insurance coding, treatment protocols, and reimbursement.
By and large the clinical medicine model remains structurally incapable of seeing pre-disease.
The clinical taxonomy is condition-specific and siloed. A man can be on lisinopril for hypertension (clinical by the system’s definition) while simultaneously deep in pre-clinical decline on sleep, alcohol, musculoskeletal deterioration, and financial stress — none of which most prescribing physicians are tracking, treating, or even asking about. The conditions that compose drift are cross-domain and synergistic; the clinical system is single-domain and episodic. And the problem extends beyond the fully disengaged: many people see primary care intermittently, fill one prescription, or attend a single counseling session. This partial engagement creates an illusion of being “handled” while the underlying multi-domain decline continues unaddressed.
The Wellness Industry View
The consumer wellness market operates on a tacit market segmentation: sick people (clinical), normal people, and healthy optimizers. Capital and product development flow overwhelmingly to the extremes — clinical digital health solutions for diagnosed populations (Hinge Health, Teladoc, Lyra, Pelago) and consumer wellness products for the self-directed optimizer class (Whoop, Levels, Function Health, Eight Sleep).
The reason for this is pretty simple: the spend is with 3rd party payors or the affluent.
The vast middle — people who are neither self-identified as sick enough for a diagnosis nor motivated enough to buy a $30/month wearable subscription — get very little.
The Missing Category: Pre-Clinical Drift
Between “healthy” and “clinical” are adults in measurable decline across one or more health domains who carry no official diagnosis, are not engaged in provider relationships to address the decline and would refuse the label “patient” or “at-risk.” They are not in crisis. They are mostly functional for day-to-day demands. They describe themselves as “fine.” But they are slowly getting worse, and the system has no mechanism to reach them before something breaks — a diagnosis, an injury, a hospitalization, a disability claim, a crisis.
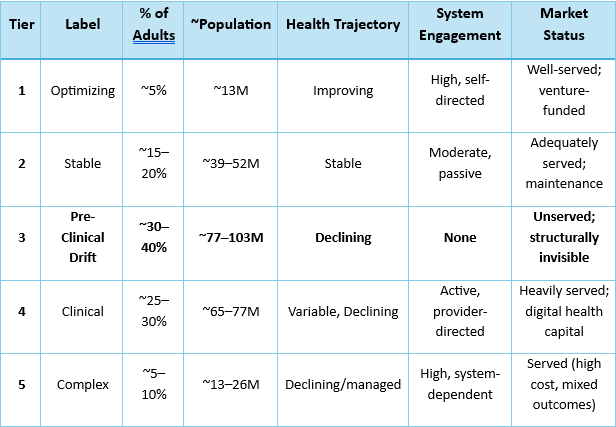
Part II: The Health Engagement Gradient — Five Tiers
The following framework segments the U.S. adult population (~258 million, Census 2024) by health trajectory and system engagement.
The tiers are not condition-specific; they describe a person’s overall health posture. A single individual’s position on the gradient is determined by their worst domain — someone who exercises regularly but drinks heavily and sleeps five hours a night is in drift regardless of his or her cardiovascular fitness.
Tier 1: Actively Optimizing (~5% of U.S. adults | ~13 million)
Profile: Improving trajectory, high self-direction. Biohackers, serious competitive athletes, patients of longevity-focused physicians (Medicine 3.0), quantified-self practitioners. Health-literate, high spend, digitally engaged.
Defining behaviors: Tracks biomarkers proactively (continuous glucose monitors, advanced blood panels, HRV, sleep staging). Trains intentionally with structured programming. Actively manages nutrition, sleep, and recovery. Seeks out emerging science. Willing to pay significant out-of-pocket costs for health optimization.
Market served by: Function Health, Whoop, Levels, Eight Sleep, InsideTracker, Attia/Huberman ecosystem, boutique longevity clinics, compounding pharmacies, high-end coaching. Venture capital has flowed heavily into this tier.
Size rationale: The quantified-self and biohacker market remains a niche within the broader fitness market. Whoop reports ~1 million subscribers. Function Health launched to significant demand but remains a fraction of the adult population. The serious athlete population (NSCA estimates ~7–10 million Americans engaged in structured strength or endurance training) overlaps but is not coextensive. If we want to further contextualize, we might say:
1–2%: full‑stack, multi‑wearable, multi‑clinic, heavy‑spend biohackers.
3–5%: broader “Actively Optimizing” group with at least one advanced device or regular lab work plus structured training.
10–20%: “Health‑aspirational” group that follows optimization content, occasionally buys a device or advanced supplement, but does not consistently manage all pillars.
Tier 2: Stable and Maintaining (~15–20% of U.S. adults | ~39–52 million)
Profile: Stable trajectory, moderate self-direction. Genuinely healthy across most major markers — normal weight, no prediabetes, normal blood pressure, adequate sleep (≥7 hours), moderate or no alcohol use. Exercises semi-regularly, sees a primary care provider annually, does not think much about health because nothing is wrong.
Defining behaviors: Meets basic physical activity guidelines (though only 25% of all U.S. adults meet combined aerobic and muscle-strengthening guidelines per CDC). Sleeps adequately. Drinks moderately or not at all. BMI in normal range. No chronic pain. No mood or anxiety disorder. No financial crisis.
Size rationale — building from the negative space:
This tier is smaller than most people assume. The data eliminates large portions of the adult population:
Overweight/obese: 72.4% of adults 20+ are overweight or obese (NCHS, 2021–2023). Eliminating only the obese (40.3% age-adjusted) still leaves the overweight. Being overweight alone does not necessarily place someone in the drift, but it correlates heavily with other markers.
Cardiometabolic: Tufts recently argued that even optimistic cardiometabolic health data show only 6–7% of U.S. adults have good cardiometabolic health
Insufficient sleep: 35–37% of adults report sleeping fewer than 7 hours (CDC BRFSS, 2022; NHIS data consistent).
Physical inactivity: 25.3% of adults report no leisure-time physical activity whatsoever (CDC BRFSS, 2017–2020). Only 25% of adults meet combined aerobic + strength guidelines (CDC Active People, Healthy Nation).
Binge drinking: 20.1% of adults 12+ engaged in past-month binge drinking (SAMHSA NSDUH, 2024); among adults 26+, rates remain in the high teens.
Chronic pain: 24.3% of adults experienced chronic pain in 2023, with 8.5% experiencing high-impact chronic pain (NCHS Data Brief 518, 2024).
Prediabetes: 38% of adults have prediabetes (CDC); approximately 80% unaware.
Hypertension: ~48% of adults have hypertension (NCHS Data Brief 511, 2024); only 59% are aware.
Mental health: 23.4% of adults had any mental illness in the past year (SAMHSA NSDUH, 2024).
These conditions overlap heavily in the same individuals, so the math is not additive. A person who is obese, sleeps poorly, and has undiagnosed prediabetes is counted once across all three prevalence estimates but occupies one slot in pre-clinical drift. When you subtract people in drift, the clinical population, and the complex/high-acuity population, the residual — genuinely healthy, stable, no markers of decline — is 15–20% at best.
Market served by: Primary care (annual checkups), mainstream gym memberships, basic wellness benefits. These people are underserved not because nothing reaches them, but because their needs are maintenance-level and the market correctly prices accordingly.
Tier 3: The Drift — Pre-Clinical Decline (~30–40% of U.S. adults | ~77–103 million)
Model estimate based on combining national prevalence data across metabolic, cardiovascular, sleep, MSK, substance use, and mental health domains. Precise overlap requires NHANES cross-tabulation; see Development Notes.
Profile: Declining trajectory across one or more health domains. No diagnosis addressing the decline — or diagnosed in one domain but actively drifting on others without management. Little or quiet self-identification as “having a problem.” Functional and employed. Typically describe themselves as “fine” even as they acknowledge day-to-day complaints.
This is the central claim of this paper and the population the framework exists to make visible.
Defining Characteristics
Measurable deterioration that has not crossed a clinical threshold — or has crossed one but remains undiagnosed. The person is getting worse, but slowly enough that they’re not acting. Many people here begin to normalize dysfunction as part of daily life.
Cross-domain compounding. Pre-clinical drift is never one thing. It is the interaction of poor sleep, rising body weight, escalating alcohol use, chronic low-grade pain, financial strain, social isolation, and declining physical capacity — each reinforcing the others in a self-amplifying cycle. The clinical system lacks a mechanism for driving wholistic change here.
Structural invisibility. A primary care physician may see the whole picture at an annual exam, but insurance codes do not capture “gradually declining across five domains simultaneously.” Screening tools don’t ask the right questions in the right sequence and benefit products require clinical self-identification.
Cultural resistance to clinical framing. The drift population — particularly men in physical occupations — will not use a product that positions them as “having a problem.” Stigma, identity, and occupational culture preclude clinical self-identification.
Quantifying Drift: Domain-by-Domain Evidence
Metabolic drift. An estimated 96 million U.S. adults have prediabetes — 38% of the adult population (CDC National Diabetes Statistics Report). Approximately 80% are unaware. Without intervention, people with prediabetes face elevated progression risk: approximately 5–10% progress to Type 2 diabetes each year, with roughly 10–20% progressing over a decade in contemporary cohorts — higher for those at the upper end of the prediabetes range (Lancet Global Health, 2025; BMJ DRC). This single condition alone places roughly 77 million adults (96M × 80% unaware) in a state of measurable metabolic decline with no diagnosis and no treatment.
Cardiovascular drift. Approximately 48% of U.S. adults — roughly 120 million people — have hypertension under current ACC/AHA guidelines (NCHS Data Brief 511, October 2024). Of those, only 59.2% are aware of their condition. That means approximately 49 million adults have elevated blood pressure and don’t know it. Among those who are aware, only 51.2% are on medication, and only 20.7% have their blood pressure controlled to target. The young are most at risk for unawareness: among adults 18–39 with hypertension, only 27.2% are aware.
Sleep drift. Approximately 35–37% of U.S. adults — roughly 84–90 million people — report sleeping fewer than 7 hours per night (CDC BRFSS; AASM estimates 83.6 million). Insufficient sleep is associated with elevated risk for obesity, diabetes, hypertension, heart disease, stroke, anxiety, depression, and impaired cognitive performance (CDC MMWR, 2016). Sleep deprivation is not distributed equally: lower-income individuals have 22–108% higher prevalence of insufficient sleep compared to high-income individuals, depending on work vs. non-work days (NHANES 2017–2020).
Substance use drift. In 2024, 57.9 million people aged 12+ reported past-month binge drinking, and 14.5 million reported heavy alcohol use (SAMHSA NSDUH, 2024). Among adults 26+, binge drinking prevalence remains approximately 20%. Binge drinking is a strong proxy for drift but not a one-to-one mapping — not every binge drinker is in multi-domain decline, and not every person in the drift drinks heavily. However, most binge drinkers won’t reach typical clinical levels or seek help for alcohol use disorder and will never enter treatment. They occupy the gray zone — heavier-than-they-should-be drinking that disrupts sleep, impairs recovery, elevates injury risk, and degrades cognitive performance without triggering any clinical flag. For employers, this is where Monday no-shows, near-misses, and presenteeism drag live.
Musculoskeletal drift. In 2023, 24.3% of U.S. adults (approximately 63 million) experienced chronic pain, up from 20.4% in 2019 (NCHS Data Brief 518, 2024; NCHS Data Brief 390, 2020). 8.5% experienced high-impact chronic pain that limited life or work activities. Chronic pain prevalence increases sharply with age: 12.3% among adults 18–29, rising to 30.7% among adults 45–64. Among adults in physical occupations, prevalence is almost certainly higher, though occupation-specific NHIS breakouts are limited. The MSK-to-opioid pipeline is well-documented: chronic pain is a primary pathway to prescription opioid exposure, dependence, and eventual substance use disorder.
Physical deconditioning. 25.3% of adults report no leisure-time physical activity at all (CDC BRFSS, 2017–2020). Only 1 in 4 adults meets both aerobic and muscle-strengthening guidelines (CDC Active People, Healthy Nation). 55.1% of U.S. adults have insufficient physical activity levels per WHO guidelines (NHANES 2017–2018 analysis). These figures likely understate the problem: NHANES accelerometer data consistently show that self-reported activity overstates true activity levels, meaning objective deconditioning is even more prevalent than survey estimates suggest. Physical deconditioning accelerates every other drift domain — metabolic, cardiovascular, musculoskeletal, sleep, and mental health.
Body composition drift. 40.3% of U.S. adults are obese; 72.4% are overweight or obese (NCHS Data Brief 508, 2024). Severe obesity (BMI ≥ 40) has increased from 7.7% to 9.7% over the past decade. Obesity is highest among adults 40–59 — precisely the age range of the Maximus target demographic. Adults with lower education levels (44.6% obesity prevalence) are significantly more affected than college graduates (31.6%).
Mental health drift. 23.4% of adults (61.5 million) had any mental illness in the past year (SAMHSA NSDUH, 2024). 7.4% of adults had moderate or severe symptoms of generalized anxiety disorder. Among the broader population experiencing subclinical anxiety, depressive symptoms, or chronic stress that does not meet diagnostic criteria, the numbers are substantially larger. The treatment gap is well-documented: in construction, only 4.8% of workers saw a mental health professional despite 15.4% reporting symptoms (CPWR, 2024). Across all industries, 23% of adults saw a mental health professional (Gallup) — meaning 77% did not, including many with clinically significant symptoms.
Financial stress as physiological stressor. 56% of frontline workers report living paycheck to paycheck. Financial stress is not merely a budgeting problem — it produces elevated cortisol, disrupted sleep, impaired executive function, and elevated risk-taking behavior. Workers under chronic financial strain report higher rates of insomnia, depression, anxiety, substance use, and workplace accidents. It is a drift accelerant that touches every other domain.
The Overlap Problem and the Pre-Clinical Drift Estimate
These conditions are not independent. They cluster in the same people: the obese man with prediabetes also sleeps poorly, drinks too much on weekends, has a bad back, and worries about money. The clinical system counts him five times across five condition-specific prevalence estimates. The drift framework counts him once.
Base estimate: At minimum, 25–30% of U.S. adults — approximately 65–77 million people — are in measurable pre-clinical decline across two or more health domains without a diagnosis or treatment plan addressing the trajectory. This is a floor, built from the most conservative reading of the overlap data.
Central estimate: 30–40% (~77–103M) when accounting for the full range of drift domains and single-domain decline with clear trajectory toward multi-domain compounding. This is the working estimate used in this paper, labeled as a model estimate pending NHANES cross-tabulation.
Upper bound: 40–45% (~103–116M) when including early-stage single-domain drift (e.g., the otherwise healthy 32-year-old whose only marker is insufficient sleep and rising BMI, but who is clearly on a trajectory toward multi-domain decline within a decade).
The component data supporting these estimates:
Prediabetes alone (96M, 80% unaware = ~77M unaware) gets you most of the way to 90M
Undiagnosed hypertension (~49M) overlaps heavily but adds millions who are normal-weight and non-prediabetic
Adding insufficient sleep (84–90M), physical inactivity (65M inactive or insufficient), chronic pain (63M), and binge drinking (58M) substantially expands the pool, even with heavy overlap
For working-age men (30–55) in physical occupations, the drift prevalence is almost certainly 50–65%. Every risk factor documented above — obesity, insufficient sleep, physical inactivity outside of work, binge drinking, chronic pain, financial stress — is more prevalent among lower-income adults, adults without college degrees, adults in rural and semi-rural areas, and adults in physically demanding occupations. The demographics compound. These are inferred ranges based on higher domain-specific prevalence among the relevant demographic cohorts; direct multi-domain survey data in this population is not yet available.
Tier 4: Clinical / Managed (~25–30% of U.S. adults | ~65–77 million)
Profile: Diagnosed with at least one chronic condition. Some engagement with the healthcare system — has a provider, has a prescription, has a treatment plan. Adherence and outcomes vary widely.
Size rationale:
40.1 million adults have diagnosed or undiagnosed diabetes (CDC, 2023); 29.1 million diagnosed.
~120 million adults have hypertension; of those aware (~71M), the majority are in some form of treatment.
61.5 million adults had any mental illness in the past year (SAMHSA, 2024); treatment rates vary by severity.
Netting for overlap: roughly 65–77 million adults are carrying at least one active diagnosis and interacting with the clinical system in some form. Many are inadequately treated — only 20.7% of hypertensive adults have controlled blood pressure — but they are at least visible to the system.
Counting note: For this framework, we classify individuals by their primary system engagement. A person with diagnosed hypertension on medication is Tier 4 even if they are also drifting on sleep, alcohol, and MSK. This avoids double-counting. But see the critical subpopulation discussion below.
The Drift-Plus-Diagnosis Subpopulation
This is where the framework reveals something the standard taxonomy hides entirely.
Recent CDC data show that 76% of U.S. adults carry at least one of twelve diagnosed chronic conditions, and 51% have multiple (CDC, 2023). Separate NHANES analyses find multimorbidity (≥2 chronic conditions) in roughly 50–60% of adults overall — and even among 20–29-year-olds, the rate exceeds 20%. These are diagnosed conditions; they do not count subclinical risk factors like prediabetes, poor sleep, or heavy drinking.
This means a large portion of Tier 4 — people technically “in the system” — are simultaneously in behavioral drift on domains their provider isn’t tracking. The diabetic on metformin whose blood sugar is controlled but who sleeps five hours a night, drinks four beers every Friday and Saturday, has a bad knee he ignores, and lives paycheck to paycheck. He has a diagnosis and a provider, but is also deep in drift.
From a behavior-change and product-design perspective, these individuals look identical to pure Tier 3: no one is managing the drift domains, no product reaches them where they are, and the behavioral trajectory is declining
The serviceable behavioral-drift population is therefore substantially larger than Tier 3 alone. It includes pure drift (Tier 3, ~30–40% of adults) plus the still-drifting subset of Tier 4 (a large fraction of the 25–30% in Tier 4). Under a behavioral-trajectory lens, the population experiencing active drift across one or more unmanaged domains likely exceeds 50% of U.S. adults. This is not an aggressive claim — it follows directly from the multimorbidity data combined with the domain-specific prevalence of sleep deprivation, physical inactivity, binge drinking, and chronic pain, all of which are largely unaddressed even in patients with one or more managed diagnoses.
Market served by: Hinge Health (MSK), Lyra (mental health), Pelago (SUD), Teladoc/Amwell (primary care), Livongo/Dexcom (diabetes management), pharmacy benefit managers, disease management programs, EAPs (partially), health plan care management.
Tier 5: Complex / High-Acuity (~5–10% of U.S. adults | ~13–26 million)
Profile: Multiple comorbidities, high utilization, often disabled or functionally limited. Dialysis, advanced heart failure, late-stage COPD, active addiction in intensive treatment, serious mental illness, disability.
Size rationale: The well-documented concentration of healthcare spending — roughly 5% of patients drive 50% of costs — provides the lower bound. Adding those with serious mental illness (14.6 million, SAMHSA 2024), those in active SUD treatment, and those with significant functional limitations pushes toward 10%.
Market served by: Health system disease management, intensive case management, disability programs, long-term care, specialty behavioral health. Heavily served (though not always effectively) by the existing system.
Part III: The Gradient in Summary
The central finding: Tier 3, pre-clinical drift, is a plurality of American adults under reasonable overlap assumptions — very likely the largest or co-largest tier in the framework — and the only tier with minimal product design, no insurance code, no reimbursement pathway, and no systematic intervention designed to reach it.
The expanded finding: When the drift-plus-diagnosis subpopulation (Tier 4 individuals actively drifting on unmanaged domains) is included, the behaviorally drifting population likely exceeds 50% of U.S. adults. This is consistent with CDC multimorbidity data showing 76% of adults carry ≥1 chronic condition and 51% carry ≥2, combined with the domain-specific prevalence data showing that sleep deprivation, physical inactivity, binge drinking, and chronic pain remain largely unaddressed even in patients with existing diagnoses.
Part IV: Where the Drift Concentrates — Workforce Segmentation
Pre-Clinical drift is not uniformly distributed. It concentrates in specific workforce segments where occupational demands, cultural norms, access barriers, and socioeconomic factors compound. Using BLS Employment Projections data (2024 baseline), the non-knowledge-work U.S. workforce breaks into five clusters:
Cluster A: Trades & Physical Production — ~22 million workers
Industries: Construction (8.2M), Manufacturing (12.8M), Mining/Utilities (~1.2M)
Drift concentration: Very high (estimated 50–65%, inferred from higher prevalence of MSK, SUD, sleep deprivation, and mental health treatment gaps in this demographic; direct multi-domain survey data not yet available)
This is the epicenter. Construction is 90%+ male. Over 63% of construction workers are 35–64 (CFMA). The suicide rate among male construction workers is approximately 75% higher than working men overall (CDC MMWR, 2023). Only 4.8% saw a mental health professional despite 15.4% reporting symptoms (CPWR, 2024). 16.5% report heavy alcohol use — nearly double the all-industry average (SAMHSA, 2008–2012 combined). Chronic MSK exposure is occupational — these workers break their bodies for a living, then self-manage the pain with alcohol, ibuprofen, and stoicism. EAP utilization among frontline workers runs 2–5% at best.
Every drift domain — sleep, substance use, MSK, metabolic, cardiovascular, mental health, financial stress — is elevated in this cluster relative to the general population. The culture rewards toughness and punishes vulnerability. The work is physically demanding, often seasonal or unpredictable, and geographically mobile in ways that weaken social ties.
Employer pain: Turnover at 20–30%+ (some analyses show 60–70% including seasonal separations). Absenteeism above national average. Workers’ compensation costs driven by MSK. Suicide rate 5× jobsite fatality rate. 500,000 additional workers needed in 2026 (AGC), meaning every lost worker is exponentially harder to replace.
Cluster B: Transportation & Logistics — ~6.7 million workers
Industries: Transportation & Warehousing (6.7M)
Drift concentration: High (estimated 45–55%, inferred from occupational risk profile; direct multi-domain data not yet available)
Heavily male, particularly in trucking and warehousing. Isolated work (long-haul trucking is essentially solitary confinement in motion). Shift-based and often nocturnal in warehousing. Poor sleep is endemic and occupationally imposed. Sedentary for hours (driving) then physically demanding (loading/unloading). Food access on the road is fast food. Obesity, diabetes, and sleep apnea prevalence among commercial drivers is well-documented at rates significantly above the general population — studies consistently find obesity prevalence of 50–70% and obstructive sleep apnea prevalence of 28–35% among commercial motor vehicle operators, compared to ~40% and ~10–15% respectively in the general adult population.
Employer pain: DOT compliance and driver health certification failures. Fatigue-related accidents. High turnover (trucking turnover rates historically 90%+ for large carriers). Growing labor shortage.
Cluster C: Retail & Hospitality — ~29.7 million workers
Industries: Retail Trade (15.5M), Accommodation & Food Services (14.2M)
Drift concentration: Moderate (estimated 30–40%)
Mixed gender. Younger average age. Higher turnover velocity (~60–80% annually in food services). Dominant drift domains are financial stress (low wages, unpredictable scheduling, no benefits), insufficient sleep (shift work), and substance use (service industry culture). Lower MSK burden than trades but significant musculoskeletal complaints in food preparation, housekeeping, and warehouse-adjacent retail roles.
Cultural profile differs from Cluster A: less stoicism, more economic precarity. The drift here looks less like “tough guy won’t go to the doctor” and more like “can’t afford to miss a shift, can’t afford care, too exhausted to cook or exercise.”
Employer pain: Turnover is the existential cost. Training costs for replacements. Customer experience degradation from disengaged, fatigued, financially stressed frontline staff.
Cluster D: Care & Service Professions — ~41 million workers
Industries: Healthcare & Social Assistance (22.5M private), Educational Services (~18.7M combined private + public)
Drift concentration: Moderate (estimated 30–40%), but different profile
Predominantly female (nursing 85%+, teaching 75%+). Drift domains skew toward compassion fatigue, burnout, emotional exhaustion, insufficient sleep (nursing shift work), and MSK (patient handling in nursing, prolonged standing in teaching). Substance use rates lower than trades but mental health burden higher and more recognized.
Critical difference: this population is more likely to engage with therapeutic framing and less likely to reject clinical self-identification. The cultural barrier is not stigma around vulnerability — it’s lack of time, lack of reciprocal care, and systemic deprioritization of their own health while caring for others.
Employer pain: Burnout-driven turnover (nursing turnover 18–27% depending on specialty and setting). Staffing shortages across both healthcare and education. Patient/student outcome degradation from burnt-out staff.
Cluster E: Other Frontline / Admin — ~15.8 million workers
Industries: Administrative & Support Services (9.2M), Other Services (6.6M)
Drift concentration: Variable (estimated 25–40%)
Mixed. Includes janitors, maintenance workers, landscapers (profile closer to Cluster A), as well as office admin and clerical staff (profile closer to knowledge workers). Drift prevalence correlates with physical-labor and outdoor-work subtypes.
Part V: The Market Implication
The Unserved Market
Pure drift (Tier 3) at 30–40% of U.S. adults represents approximately 77–103 million people. Including the drift-plus-diagnosis subpopulation of Tier 4, the total behaviorally drifting population is likely to exceed 130 million adults.
Why Nobody Has Built for This
No diagnosis → no reimbursement. The U.S. healthcare system pays for disease, not for pre-disease. There is no CPT code for “gradually declining across five domains simultaneously.” This eliminates the payor pathway that funds most digital health companies.
No self-identification → no direct-to-consumer demand. The optimizer market (Tier 1) buys products because they want to improve. The drift population doesn’t buy because they don’t recognize or want to acknowledge the decline. DTC wellness products require the consumer to self-identify as wanting change. The drift population won’t.
No clinical framing → no employer benefit category. EAPs, wellness programs, virtual MSK solutions, and telehealth all require the employee to identify a specific problem and seek a specific solution. The drift population doesn’t do this. The existing benefit architecture assumes clinical framing that this population rejects.
Wrong modality. Every existing product requires an app download, account creation, sustained digital engagement, scheduling, and/or a private space for a phone call. For a construction worker driving to the jobsite at 5:45 AM, none of that exists.
Wrong register. “Wellness,” “mindfulness,” “mental health,” “self-care” — the framing that works for Tiers 1 and 2 (and to some extent Tier 4) can be actively repellent to a Tier 3 male population in physical occupations. The cultural mismatch for some demographics is a product design problem.
Part VI: The Drift as Feeder System
The final structural argument: the drift is not a static population. It is the primary pipeline feeding Tiers 4 and 5.
Among people with prediabetes, approximately 5–10% progress to Type 2 diabetes each year without intervention; over a decade, 10–20% of contemporary cohorts convert, with substantially higher rates among those at the upper end of the prediabetes range (Lancet Global Health, 2025; BMJ DRC). At 96 million prediabetic adults, even the lower end of these estimates means millions of new diabetes diagnoses annually from the drift.
Uncontrolled hypertension is the largest single contributor to cardiovascular mortality (AHA). With 49 million adults unaware they have hypertension and only 20.7% of those treated achieving control, the cardiovascular feeder pipeline from the drift is enormous.
Chronic pain that goes unaddressed is a primary pathway to opioid exposure, dependence, and substance use disorder (CDC/NIOSH).
Untreated subclinical depression and anxiety escalate to clinical disorders at well-documented rates.
Every year, millions of people move from Tier 3 to Tier 4 — from “fine” to diagnosed. The clinical system then spends enormous resources managing conditions that were preventable for years before they crossed the diagnostic threshold. Chronic disease and high-acuity care drive the majority of U.S. healthcare spending — over $4.5 trillion annually (CMS).
Even modest reductions in progression from pre-clinical risk to diagnosed disease have outsize economic impact. The drift is not just an underserved market. It is the upstream source of the chronic disease burden that consumes 90% of U.S. healthcare spending.
An intervention that slows or reverses the drift — even modestly — would not merely serve an underserved population. It would reduce the inflow to the costliest tiers of the healthcare system. That is the systemic case for investment.
There is also an occupational justice argument that deserves explicit statement: the most physically demanding, least clinically engaged workers carry a disproportionate drift burden. The same workers who build the infrastructure, drive the freight, offer the care, and maintain the systems that the economy depends on are the same people least likely to have the time, resources, cultural patterning, and tools to access support.
Source Index
Population & Prevalence Data
CDC National Diabetes Statistics Report (2023/2026 update): 40.1M with diabetes; 96M with prediabetes; 80% of prediabetic adults unaware
CDC Chronic Conditions (2023): 76% of U.S. adults carry ≥1 of 12 diagnosed chronic conditions; 51% have multiple
NCHS Data Brief 511 (October 2024): Hypertension prevalence 47.7% (August 2021–August 2023); awareness 59.2%; treatment 51.2%; control 20.7%
NCHS Data Brief 508 (September 2024): Obesity prevalence 40.3% age-adjusted; overweight + obese 72.4%
NCHS Data Brief 518 (November 2024): Chronic pain 24.3% (2023); high-impact chronic pain 8.5%
SAMHSA NSDUH (2024): 134.3M current alcohol users; 57.9M binge drinkers; 14.5M heavy alcohol users; 48.4M (16.8%) with past-year SUD; 61.5M (23.4%) with any mental illness; 14.6M (5.6%) with serious mental illness
CDC BRFSS (2022): ~35–37% of adults report <7 hours sleep; ~83.6M adults with insufficient sleep (AASM estimate)
CDC BRFSS (2017–2020): Physical inactivity prevalence 25.3% nationally
NHANES 2017–2018 (PMC analysis): 55.1% of adults had insufficient physical activity per WHO guidelines; only ~45% met recommended levels; accelerometer data shows self-reported activity overstates true activity
Million Hearts / AHA: ~120M adults with hypertension; ~49M unaware; 34.8M untreated
CDC MMWR (2016): 65.2% of adults reported healthy sleep duration (≥7 hours); 34.8% insufficient
Lancet Global Health (2025); BMJ Diabetes Research and Care: Prediabetes annual progression 5–10%; 10-year progression 10–20% in contemporary cohorts
CMS National Health Expenditure Data: Total U.S. healthcare spending >$4.5 trillion annually
Workforce & Employment Data
BLS Employment Projections (2024 baseline): Construction 8.2M; Manufacturing 12.8M; Transportation & Warehousing 6.7M; Retail Trade 15.5M; Accommodation & Food Services 14.2M; Healthcare & Social Assistance (private) 22.5M; Educational Services (private) 4.0M; State & Local Government 20.4M; Administrative & Support 9.2M; Other Services 6.6M
Gartner/Workday: ~2.7 billion frontline/deskless workers globally (~80% of global workforce)
Statista / CEPR (2020): ~31.67 million frontline workers in the U.S.
CFMA: Construction workforce 90%+ male; 63%+ aged 35–64
AGC: ~500,000 additional construction workers needed in 2026
Drift-Specific / Behavioral Data
CPWR Data Bulletin (September 2024): 4.8% of construction workers saw a mental health professional; 15.4% reported symptoms of anxiety or depression
Gallup: 23% of U.S. adults saw a mental health professional in the same period
EAPA / SHRM (2023–2024): EAP utilization 2–10% across all industries; 85% of employers with EAPs report 3–5% utilization
RAND Europe (2016): Sleep deprivation costs U.S. economy $411B/year; workers sleeping <6 hours have 13% higher mortality risk
SAMHSA (2008–2012 combined): Construction workers: 16.5% heavy alcohol use (nearly 2× average); 14.3% met SUD criteria (vs. ~9.5% all workers)
CDC MMWR (Sussell et al., 2023): Construction worker suicide rate ~53–56/100K male workers vs. ~32/100K all male workers
Physical Activity & Deconditioning
CDC Active People, Healthy Nation: Only 1 in 4 adults meet combined aerobic + strength guidelines; ~31M adults 50+ are inactive; inactivity contributes to 1 in 10 premature deaths; associated with $192B in annual healthcare costs
NHANES 2017–2018 (PMC): Prevalence of recommended physical activity level: 29.6% among diabetic adults; 37.2% among hypertensive adults; 32.4% among adults with disability
Development Notes
What this paper establishes
A named, quantified population tier — the drift — that is structurally invisible to the existing health and wellness market
Domain-by-domain prevalence evidence from CDC, NHANES, SAMHSA, and NCHS showing that each drift domain affects tens of millions of adults
A conservative base estimate of 25–30% and a central model estimate of 30–40% (~77–103M adults) in pure pre-clinical drift, with an expanded behavioral-drift population (including drift-plus-diagnosis) likely exceeding 50% of adults
Workforce segmentation showing where the drift concentrates and why physical-occupation clusters (Trades, Transport) are the most acute
The structural reasons — no diagnosis code, no self-identification, no reimbursement, wrong modality, wrong register — that explain why no product category currently serves this population
The drift as feeder system: the primary upstream pipeline into chronic disease, with even modest intervention reducing inflow to the costliest tiers of U.S. healthcare
What needs further validation
NHANES cross-tabulation (highest priority). The central estimate is built from component prevalence data, not from a single cross-tabulated source. Running NHANES public-use microdata to count adults who carry ≥2 of: prediabetes, undiagnosed hypertension, obesity, insufficient sleep (self-reported), binge drinking — and who have no major diagnosis — could produce a concrete “drift proxy” number from a single dataset.
Occupation-specific drift prevalence. The claim that 50–65% of Cluster A workers are in the drift is inferred from occupation-specific data on individual domains (suicide, SUD, MSK) combined with demographic correlates (age, income, education, rurality). Direct multi-domain survey data in construction workers would be the single most valuable addition.
The overlap coefficients. The assertion that conditions cluster in the same people is directionally well-supported by NHANES comorbidity data, but the precise co-occurrence rates (e.g., what share of prediabetic adults also have insufficient sleep and binge drinking) need quantification.
Tier 2 positive-definition sizing. The residual-method estimate (15–20%) is the weakest link. A positive definition from NHANES — adults who meet all of: normal BMI, no prediabetes, controlled blood pressure, ≥7 hours sleep, no binge drinking, no chronic pain, no mood disorder — would likely confirm or reduce this estimate. If it comes in at 10–12%, the drift story gets even stronger.
Drift-plus-diagnosis quantification. The claim that a large fraction of Tier 4 is also behaviorally drifting needs sharper data. NHANES could estimate: among adults with ≥1 diagnosis, what share also carries ≥2 unmanaged risk factors? This would anchor the “50%+ of adults in behavioral drift” claim.
Annual Tier 3 → Tier 4 flow. The feeder-system argument is well-supported by prediabetes conversion and hypertension progression data, but a comprehensive estimate of annual new diagnoses flowing from the drift population would strengthen the systemic case for investors and policymakers.
Sleep apnea and obesity prevalence among commercial drivers. Would ground the Cluster B (Transport) drift claim with condition-specific outcome anchors rather than inference from demographic correlates alone.